RDW Blood Test: What High or Low Results Mean With MCV
An RDW blood test measures how much your red blood cells vary in size. Most labs call about 11.5% to 15% normal. On its own, however, a high RDW does not name a disease. Read next to your MCV (average cell size), though, it points to the most likely cause of anemia, and after 45 it also tracks with long-term health.
RDW is the line most people skip on a complete blood count. Honestly, I did too, until I noticed mine creeping up from one check-up to the next while everything around it stayed normal. So, eventually, I went to the studies behind it. As a result, this guide gives you what the big health sites leave out: a full RDW and MCV pattern grid, the actual mortality numbers from three large studies, and three worked example reports.
What is an RDW blood test?
An RDW blood test is not a separate draw. Instead, it is one line of your CBC blood test, calculated by the same machine that counts your cells. Specifically, RDW stands for red cell distribution width. A low or normal number means your red cells are similar in size; a high number means sizes are mixed, which doctors call anisocytosis.
Also, no fasting or special preparation is needed, according to MedlinePlus. However, the normal range depends on the lab and the analyzer. That is why your report prints its own range next to your result, and you should always compare against that first.
RDW-CV vs RDW-SD: two ways to report the same spread
To begin with, most US reports show RDW-CV, a percentage. In other words, it is the spread of cell sizes divided by the average size. Some labs also print RDW-SD, a direct width measured in femtoliters (fL). Either way, both describe the same thing, so read whichever your report flags and use its printed range.
| Version | Units | Typical adult range | Where the number comes from |
|---|---|---|---|
| RDW-CV | Percent (%) | About 11% to 15%; some labs print 12% to 15% | Patel 2009 reference range; Cleveland Clinic patient guide |
| RDW-CV, research cut-off | Percent (%) | 14.5% or higher counted as “mixed sizes” | Bessman classification as applied in the Henan Rural Cohort (2023) |
| RDW-SD | Femtoliters (fL) | Lab-specific; use the range on your report | Varies by analyzer |
RDW blood test results with MCV: the six patterns
Still, a high RDW only becomes useful once you pair it with MCV, the average size of your red cells. For instance, in 1983 Bessman and colleagues showed that crossing these two numbers sorts most anemias into six groups. As a result, doctors still use this grid to decide which follow-up test to order first.
| Your MCV | RDW normal (cells similar in size) | RDW high (cells mixed in size) | Usual first follow-up test |
|---|---|---|---|
| Low (under 80 fL, small cells) | Thalassemia trait or anemia of chronic disease | Iron deficiency is the classic cause | Ferritin; if iron is normal, hemoglobin electrophoresis |
| Normal (80 to 100 fL) | Chronic inflammation, kidney disease, recent blood loss, or no problem at all | Early iron, B12 or folate deficiency, or two deficiencies at once that average out | Ferritin, B12, folate, kidney function |
| High (over 100 fL, large cells) | Alcohol, certain medicines, liver disease, underactive thyroid | B12 or folate deficiency is most typical | B12, folate, liver tests, TSH; sometimes a blood smear |
Table: original Health Aspire summary combining the Bessman MCV and RDW classification (1983), American Family Physician guidance on microcytosis (Van Vranken, 2010), macrocytosis (Kaferle, 2009) and anemia in older adults (Lanier, 2018). Patterns show likely causes, not a diagnosis.
So why does iron deficiency widen the spread? Basically, each new wave of red cells is made with less iron, so it comes out a little smaller than the last. Meanwhile, older, normal cells are still circulating. Thalassemia trait, in contrast, makes cells that are small but uniform, so RDW often stays normal.
What does a high RDW blood test mean if you are not anemic?
First, a high RDW with normal hemoglobin usually means no anemia today. Even so, large US studies link it to higher long-term risk of death from heart disease, cancer and other causes. Importantly, the link even held in people without iron, B12 or folate deficiency. So it is a nudge to review your overall health, not a diagnosis.
What three large studies found
Overall, three large analyses point the same way, although the size of the effect differs with age and method. Here they are side by side, translated into plain terms.
| Study | Who was studied | Risk change | In everyday terms |
|---|---|---|---|
| Patel, 2009 | 8,175 US adults aged 45+, NHANES III | HR 1.22 per 1% higher RDW (95% CI 1.15 to 1.30) | An RDW of 15% vs 14% went with about 22% higher risk of death over follow-up |
| Perlstein, 2009 | 15,852 US adults, NHANES III | HR 1.23 per 0.98% higher RDW; heart disease 1.22, cancer 1.28 | A similar step up linked to deaths from heart disease, cancer and lung disease |
| Patel, 2010 (meta-analysis) | 11,827 older adults in 7 community studies | HR 1.14 per 1% higher RDW; 1.32 in 1,603 people without major disease | Smaller per-step effect in older adults, yet it held even in healthy people |
Table: original Health Aspire comparison of three peer-reviewed studies. HR = hazard ratio (1.22 means 22% higher risk). These are associations in large groups; RDW has not been shown to cause death, and no one has shown that lowering RDW itself lowers risk.
Why would red cell size predict long-term health?
Researchers suspect RDW reflects background stress on the body, such as inflammation, poor nutrition, oxidative stress and kidney or liver strain. In other words, it acts more like a smoke detector than a fire. The 2015 review by Salvagno and colleagues lists these possible drivers, while noting the mechanism is still unproven.
Three example RDW blood test reports, worked through
Below are made-up readers, clearly labeled as examples, run through the grid above. Together, they show how the same RDW can mean very different things.
- Example 1: Linda, 52. Hemoglobin 11.2 g/dL (low), MCV 76 fL (low), RDW 17.1% (high). Here, small and mixed cells form the classic iron-deficiency pattern. As a next step, ferritin. A result under 15 ng/mL makes iron deficiency likely, and doctors then look for the reason, including the gut after 50.
- Example 2: Tom, 61. Hemoglobin 14.6 g/dL (normal), MCV 92 fL (normal), RDW 15.4% (just above range). In short, no anemia. A sensible plan is to repeat it with his next CBC, review alcohol, diet and medicines, and put real effort into the risks he already knows about, such as blood pressure and cholesterol.
- Example 3: Maria, 47. Hemoglobin 12.0 g/dL (borderline), MCV 68 fL (very low), RDW 13.6% (normal). In this case, very small but uniform cells fit thalassemia trait better than iron deficiency. Therefore ferritin comes first, and hemoglobin electrophoresis if iron is normal. Iron pills would not fix trait.
Is a low RDW blood test result a problem?
First of all, a low RDW means your red cells are unusually alike in size. MedlinePlus and Cleveland Clinic both say it is not a sign of anemia and usually needs no action. Even so, it does not rule out every condition, so your doctor reads it alongside hemoglobin and MCV, just as with a high value.
How to lower a high RDW
Basically, you lower RDW by fixing the reason behind it, not by targeting the number. For example, treating iron deficiency or B12 deficiency lets new, even-sized cells replace the mixed ones over the following months. On the other hand, if no cause is found, the evidence supports the basics that protect your heart and metabolism overall.
- Ask whether iron studies, B12 and folate make sense, especially if you eat little or no meat or have heavy periods.
- Keep alcohol modest, because it is one of the most common causes of large red cells, as we explain in is 2 drinks a day too much.
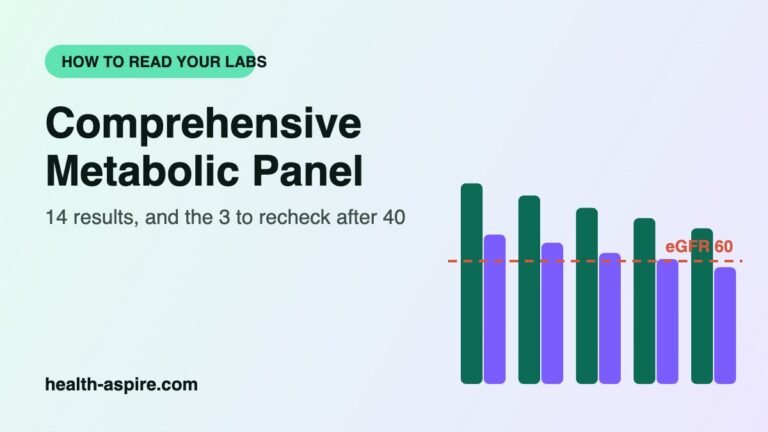
- Check kidney and liver numbers on your comprehensive metabolic panel, since both organs affect red cells.
- Finally, track your RDW over time instead of reacting to one reading.
What to do next
- Run our free A14 Health Check after 40 to see which numbers matter most for you right now.
- Use Before Your Check-up to bring your CBC questions, including RDW and MCV, to your next visit.
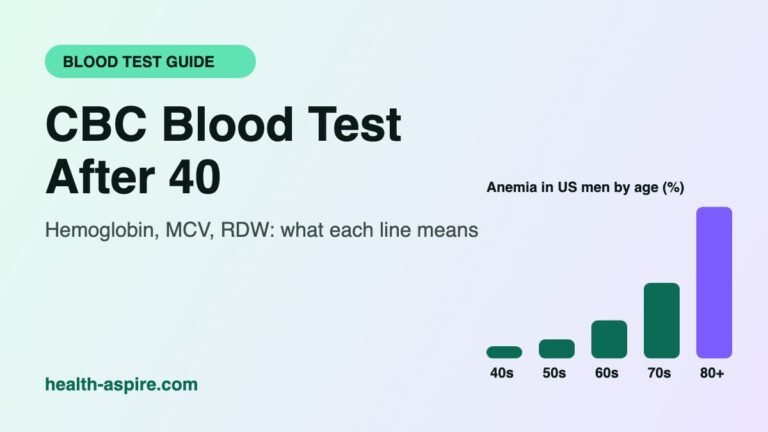
- Read the whole panel with our CBC blood test guide.
- See where blood work fits in our health assessment after 40.
- For the bigger picture on aging bodies, see facts about aging.
RDW blood test FAQ
What RDW level is considered high?
In general, most labs flag RDW-CV above about 14.5% to 15%. Researchers using the Bessman method count 14.5% or higher as mixed cell sizes. However, always use the range printed on your own report.
Does RDW go up with age?
Yes, older adults generally tend to sit higher. In seven community studies of older adults, the median RDW ranged from 13.2% to 14.6%, which is the upper half of the usual range.
Can a high RDW mean cancer?
Rarely on its own, in fact. MedlinePlus lists cancer, especially colorectal cancer, among conditions linked to high RDW, alongside liver, heart and kidney disease and diabetes. Iron deficiency after 50, though, does warrant a look at the gut.
Should I repeat the test?
If RDW is the only abnormal line, repeating it at your next routine CBC is reasonable. However, if hemoglobin is low or MCV is off, ask your doctor about follow-up tests now.
Sources
- Patel K.V., Ferrucci L., Ershler W.B., et al. Red Blood Cell Distribution Width and the Risk of Death in Middle-aged and Older Adults (Archives of Internal Medicine, 2009)
- Perlstein T.S., Weuve J., Pfeffer M.A., et al. Red Blood Cell Distribution Width and Mortality Risk in a Community-Based Prospective Cohort (Archives of Internal Medicine, 2009)
- Patel K.V., Semba R.D., Ferrucci L., et al. Red Cell Distribution Width and Mortality in Older Adults: A Meta-analysis (Journals of Gerontology Series A, 2010)
- Bessman J.D., Gilmer P.R., Gardner F.H. Improved Classification of Anemias by MCV and RDW (American Journal of Clinical Pathology, 1983)
- Salvagno G.L., Sanchis-Gomar F., Picanza A., Lippi G. Red blood cell distribution width: A simple parameter with multiple clinical applications (Critical Reviews in Clinical Laboratory Sciences, 2015)
- Zheng et al. Prevalence and morphological subtype distributions of anaemia in a Chinese rural population: the Henan Rural Cohort study (Public Health Nutrition, 2023)
- Van Vranken M. Evaluation of Microcytosis (American Family Physician, 2010)
- Kaferle J., Strzoda C.E. Evaluation of Macrocytosis (American Family Physician, 2009)
- Lanier J.B., Park J.J., Callahan R.C. Anemia in Older Adults (American Family Physician, 2018)
- MedlinePlus. RDW (Red Cell Distribution Width) (US National Library of Medicine)
- Cleveland Clinic. RDW Blood Test
This guide is for education and is not medical advice. Talk to your doctor about your own numbers and treatment. See our medical disclaimer.
Free weekly email
A short, honest health email. Every Thursday.
The week’s most useful research for life after 40, explained in plain English, plus one step picked for what matters to you. No spam, no selling your email, unsubscribe in one click.