A1C Levels Chart: Normal, Prediabetes and Diabetes Ranges After 40

An A1C result arrives as one small number, often with no explanation. Mine came on the same lab report as my high cholesterol, and I remember not knowing whether 5.6% was good news or a warning. Here is what the number means, the A1C levels chart doctors use, and what to do if yours lands in the prediabetes range.
What is A1C?
A1C, also called HbA1c or glycated hemoglobin, measures how much sugar is stuck to the hemoglobin in your red blood cells. Because red blood cells live for about three months, A1C shows your average blood sugar over the past two to three months, not just the morning of the test. That is why you do not need to fast for it, and why one good or bad day barely moves it.
A1C levels chart
| A1C | Category | What it means |
|---|---|---|
| Below 5.7% | Normal | Blood sugar is in the healthy range |
| 5.7% to 6.4% | Prediabetes | Higher than normal; the risk of type 2 diabetes is raised, and this is the stage where change works best |
| 6.5% or higher | Diabetes | Usually confirmed with a second test before a diagnosis is made |
Use the A1C levels chart as a map, not a verdict. Risk rises steadily inside the prediabetes band. An A1C of 6.2% carries more risk than 5.8%, so it is worth knowing exactly where you sit, not only which box you fall into.
A1C levels chart by age: does normal change?
No. The same A1C levels chart is used to diagnose prediabetes and diabetes at 30, 50 or 70. A1C does tend to creep up slightly with age, which is one reason screening matters more after 40, but a 60-year-old with an A1C of 6.0% is in the prediabetes range just like a 35-year-old.
What does change with age is the treatment target for people who already have diabetes. For many adults with diabetes, the goal is an A1C below 7%. For older adults with several other health conditions, doctors often choose a less strict goal, such as below 8%, because very low blood sugar can be dangerous. That decision is personal and made with your doctor.
A1C levels chart converted to average blood sugar
If you use a glucose meter, this conversion helps connect the two numbers. It uses the formula from the A1C-Derived Average Glucose study (Nathan et al., 2008).
| A1C | Estimated average glucose |
|---|---|
| 5.0% | 97 mg/dL (5.4 mmol/L) |
| 5.7% | 117 mg/dL (6.5 mmol/L) |
| 6.0% | 126 mg/dL (7.0 mmol/L) |
| 6.5% | 140 mg/dL (7.8 mmol/L) |
| 7.0% | 154 mg/dL (8.6 mmol/L) |
| 8.0% | 183 mg/dL (10.2 mmol/L) |
| 9.0% | 212 mg/dL (11.8 mmol/L) |
A1C vs fasting glucose vs glucose tolerance test
Doctors can diagnose prediabetes with any of three tests. They measure different things, so it is common for one to be in range and another not.
| Test | Normal | Prediabetes | Diabetes |
|---|---|---|---|
| A1C | Below 5.7% | 5.7% to 6.4% | 6.5% or higher |
| Fasting plasma glucose | Below 100 mg/dL | 100 to 125 mg/dL | 126 mg/dL or higher |
| 2-hour oral glucose tolerance test | Below 140 mg/dL | 140 to 199 mg/dL | 200 mg/dL or higher |
When an A1C result can mislead
A1C depends on red blood cells, so anything that changes how long they live can make the number look higher or lower than your true blood sugar. Ask your doctor whether another test makes more sense if you have:
- Anemia, recent heavy bleeding or a recent blood transfusion
- Advanced kidney disease
- Pregnancy
- A hemoglobin variant such as sickle cell trait, which is common in people of African, Mediterranean or Southeast Asian descent
Who should get an A1C test, and how often?
The American Diabetes Association recommends screening all adults from age 35, and earlier for adults with overweight plus another risk factor, such as a parent or sibling with type 2 diabetes, high blood pressure, low HDL, a history of gestational diabetes or physical inactivity.
- Normal result: repeat at least every 3 years.
- Prediabetes: test every year.
- Diabetes: usually every 3 to 6 months, as your doctor advises.

What to do if your A1C is in the prediabetes range
This is the good part. If the A1C levels chart puts you in the prediabetes range, you are at the stage where lifestyle changes have the strongest evidence. In the landmark Diabetes Prevention Program, adults with prediabetes who lost about 7% of their body weight and did 150 minutes of brisk walking a week cut their risk of developing type 2 diabetes by 58%, and by 71% in those over 60 (Knowler et al., 2002).
- Lose 5 to 7% of your weight if you have extra weight. For a 90 kg (200 lb) person, that is about 5 to 6 kg (10 to 14 lb). A quick way to see whether belly fat is part of the picture is the waist-to-height ratio calculator.
- Move 150 minutes a week. Brisk walking counts. A 10-minute walk after meals is especially effective at blunting blood sugar spikes; we explain why in our guide to improving insulin sensitivity.
- Add strength training twice a week. Muscle is where most of the sugar from a meal ends up, so keeping it matters more after 40. Start with our strength training after 40 guide.
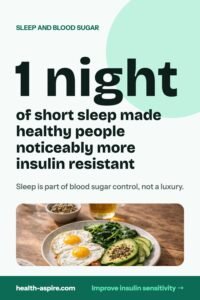
- Protect your sleep. Even a few nights of short sleep make the body less sensitive to insulin. These sleep tips for adults over 40 are a good place to start.
- Ask your doctor about medication if your risk is high. Guidelines suggest considering metformin for some adults with prediabetes, especially those under 60 with a BMI of 35 or more, an A1C of 6.0% or higher, or a history of gestational diabetes.
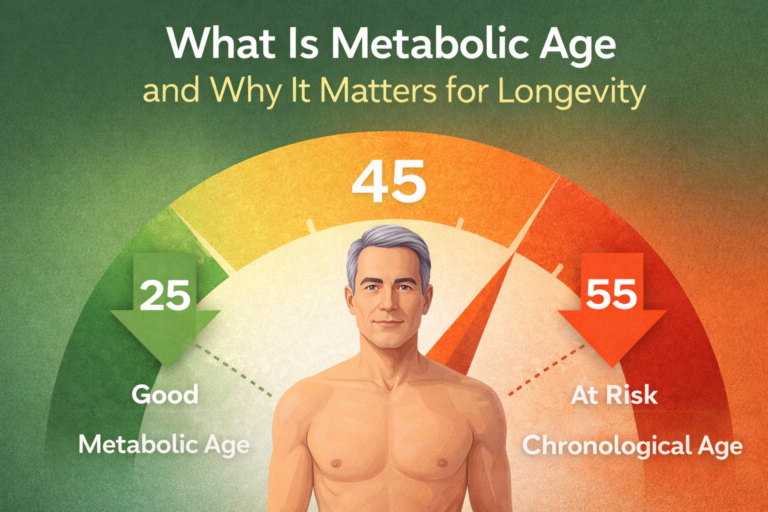
If you are curious how your overall metabolism is doing beyond A1C, try our free metabolic age calculator, or read why insulin resistance often rises with age.
FAQ
Is an A1C of 5.7% bad?
It is the lowest point of the prediabetes range. It is not diabetes, and it is not an emergency, but it is a clear signal to act: this is the stage where weight loss, activity and sleep make the biggest difference.
Can prediabetes be reversed?
Often, yes. Many people bring their A1C back below 5.7% with the steps above. Even when it does not return to normal, lifestyle change still lowers the chance of progressing to type 2 diabetes.
Do I need to fast before an A1C test?
No. A1C reflects the past two to three months, so eating beforehand does not change it. If your doctor orders a fasting glucose test at the same time, follow their fasting instructions for that test.
What is a normal A1C for a 60-year-old?
Below 5.7%, the same as for younger adults; the A1C levels chart does not change at 60. Different, less strict targets apply only to older adults who already have diabetes and are being treated for it.
- How to improve insulin sensitivity
The habits that lower blood sugar most.
- Insulin resistance and aging
Why the same food hits differently at 45.
- Metabolic health after 40
The five markers that matter for longevity.
Sources
- American Diabetes Association. Standards of Care in Diabetes, section 2: Diagnosis and Classification of Diabetes
- Centers for Disease Control and Prevention. National Diabetes Statistics Report
- Knowler W.C., et al. Reduction in the incidence of type 2 diabetes with lifestyle intervention or metformin (New England Journal of Medicine, 2002)
- Nathan D.M., et al. Translating the A1C assay into estimated average glucose values (Diabetes Care, 2008)
- National Institute of Diabetes and Digestive and Kidney Diseases. The A1C Test and Diabetes
Free weekly email
A short, honest health email. Every Thursday.
The week’s most useful research for life after 40, explained in plain English, plus one step picked for what matters to you. No spam, no selling your email, unsubscribe in one click.