Blood Pressure Chart by Age: Averages vs. Healthy Targets
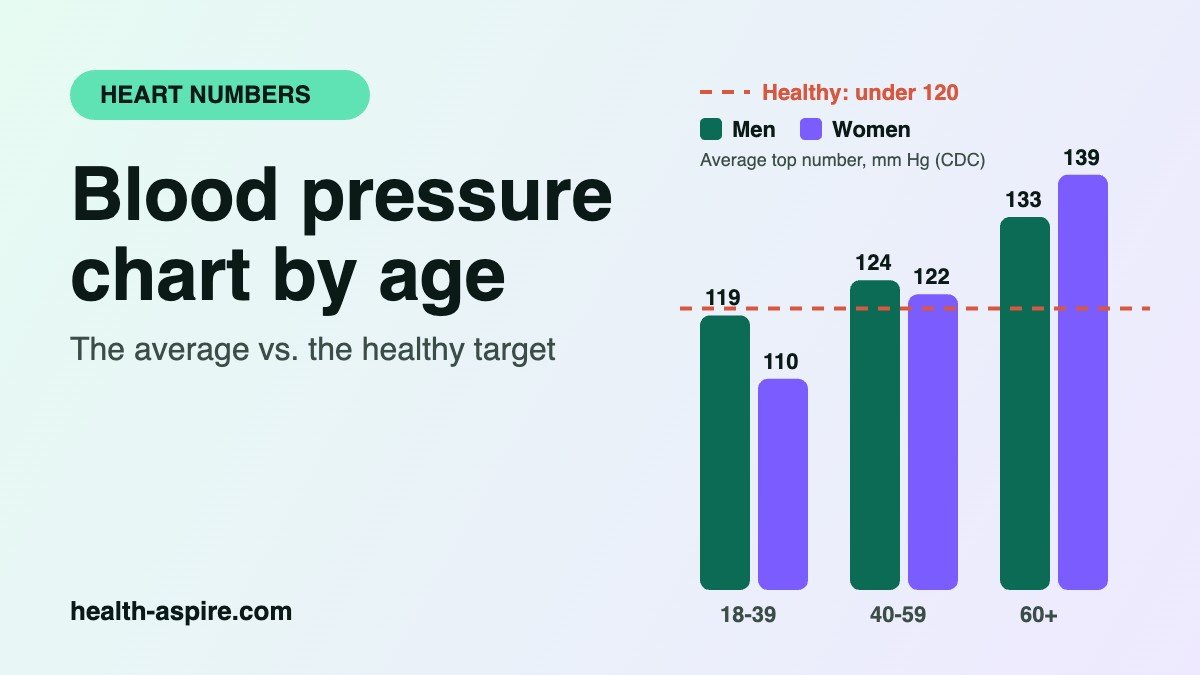
A blood pressure chart by age reveals something most charts quietly skip: the average American over 60 has a reading that today’s guideline already counts as high. In fact, healthy blood pressure is under 120/80 mm Hg at every adult age, and the same cut-offs apply at 45 or 75. Instead, what changes with age is how many people drift past them.
So this guide does two things. First, it puts real CDC averages for men and women next to the 2025 American Heart Association and American College of Cardiology categories, so you can see where “typical” ends and “healthy” begins. Then, it walks three example readers through the guideline’s actual decision rules.
Blood pressure chart by age: average vs. healthy
The short answer: average systolic pressure (the top number) climbs from about 115 in young adults to about 136 after 60, while diastolic pressure (the bottom number) peaks in midlife and then falls. However, the healthy target does not move. Instead, it stays under 120/80 for every adult, at every age.
| Age | Average, men | Average, women | Where the average lands today | Share with high blood pressure (men / women) |
|---|---|---|---|---|
| 18 to 39 | 119/70 | 110/68 | Normal, though men sit 1 point below “elevated” | 30.0% / 16.4% |
| 40 to 59 | 124/77 | 122/74 | Elevated for both sexes | 55.9% / 49.0% |
| 60 and over | 133/69 | 139/68 | Stage 1 range (top number) for both sexes | 72.7% / 70.6% |
To use this blood pressure chart by age, read the last two columns together. For women over 60, the average reading of 139/68 sits one point below stage 2 for the top number. In other words, “normal for your age” and “healthy” are two very different things after 50. This is exactly why we do not publish a separate “acceptable” number for older adults: the guideline does not have one.
One honest caveat: the averages in our blood pressure chart by age come from the most recent CDC report that lists mean readings by age and sex, which covers 2001 to 2008. By contrast, the prevalence numbers are newer, from 2021 to 2023. Even so, both data sets point the same way.
How common is high blood pressure at each age group?
Very common, and in fact more so with every decade. In the latest national survey, 47.7% of US adults had high blood pressure, defined as 130/80 or higher or taking medication for it. Moreover, that share rises from about 1 in 4 adults under 40 to about 7 in 10 adults aged 60 and over.
In addition, the awareness gap is the part that should make you reach for a cuff. Among adults 40 to 59 with high blood pressure, only 56.7% knew they had it, and just 18.1% had it under control. Meanwhile, after 60, awareness rises to 73.7%, yet control is still only 29.2%.
Blood pressure chart categories at every age (2025 guideline)
The 2025 AHA/ACC guideline kept the same four categories used since 2017. In other words, your category depends on whichever number is higher. For example, 128/84 counts as stage 1, because the bottom number falls in the 80 to 89 range. Finally, the table also shows the next step the guideline usually recommends.
| Category | Top number (systolic) | Bottom number (diastolic) | What the guideline usually suggests next |
|---|---|---|---|
| Normal | Under 120 | and under 80 | Keep healthy habits; then recheck every year |
| Elevated | 120 to 129 | and under 80 | Lifestyle changes; recheck in about 3 to 6 months |
| Stage 1 | 130 to 139 | or 80 to 89 | Lifestyle changes first; medication too if you have heart disease, diabetes, kidney disease or a 10-year PREVENT risk of 7.5% or more |
| Stage 2 | 140 or higher | or 90 or higher | Lifestyle changes plus medication |
| Severe | Above 180 | and/or above 120 | Wait 5 minutes and recheck; if still this high, contact your doctor now. Call 911 if you also have chest pain, shortness of breath, numbness, weakness, vision changes or trouble speaking |
As a result, for most adults the treatment goal is under 130/80, and the guideline encourages a top number under 120 when it can be reached without side effects.
Does normal blood pressure change with age?
No. The definition of normal blood pressure stays under 120/80 at every adult age. Still, arteries do stiffen over time, which pushes the top number up and lets the bottom number sag. That is common; however, common is not harmless: the risk linked to each extra point of pressure applies at 70 just as it does at 45.
As a result, this stiffening explains a pattern you will see on many lab printouts after 60: a high top number with a normal or even low bottom number, such as 146/68. Specifically, doctors call this isolated systolic hypertension. Even so, it is still treated as hypertension, because the top number drives most of the risk in older adults.
That said, there is one nuance for older readers. For healthy adults who live independently, age alone does not loosen the target. However, for people who are frail, prone to falls or living with several serious illnesses, doctors may agree on a personal goal, so this is a conversation worth having.
Using the blood pressure chart by age: three examples
To be clear, these are made-up examples, run through the 2025 guideline rules above. Together, they show why the same blood pressure chart by age can lead to different next steps.
| Example | Average home reading | Category | What the guideline points to |
|---|---|---|---|
| Linda, 58, no other conditions | 128/76 | Elevated | Lifestyle changes (less salt, more potassium-rich food, regular activity, less alcohol) and a recheck in about 3 to 6 months |
| James, 64, type 2 diabetes | 136/82 | Stage 1 | Diabetes moves him to medication plus lifestyle changes now, aiming for under 130/80 |
| Rosa, 71, healthy, PREVENT 10-year risk 9% | 134/70 | Stage 1 (isolated systolic) | Her risk is above the 7.5% line, so medication plus lifestyle changes. At 5% risk, she would try lifestyle changes for 3 to 6 months first |
Notice that Rosa’s bottom number looks perfect. Even so, her top number and her overall risk decide the plan, not the reading that looks best.
How much does each 10 points matter?
Quite a lot. For instance, in a meta-analysis of 123 trials with more than 600,000 people, every 10 mm Hg drop in systolic pressure cut major heart and stroke events by about 20%, strokes by 27% and heart failure by 28%. Overall, deaths from any cause fell by 13%.
Similarly, the long-term view says the same thing. In data from about one million adults, each 20-point higher top number at ages 40 to 69 went with roughly double the death rate from heart disease and more than double from stroke, with no safe threshold down to at least 115/75. In short, there is no free pass at 125 or 135.
How to get a blood pressure reading you can trust
First of all, a single reading at the clinic can mislead in either direction. The guideline asks for several properly taken readings, confirmed with home or 24-hour monitoring when possible. At home, these steps from the American Heart Association make a real difference:
- Skip caffeine, exercise and smoking for 30 minutes, and empty your bladder first.
- Next, sit with your back supported and feet flat for 5 quiet minutes before measuring.
- Also, rest your bare arm on a table so the cuff sits at heart level, and use the right cuff size.
- Then take 2 readings a minute apart, morning and evening, for about a week, then average them.
After that, write the readings down with the date and time. After all, a week of numbers tells your doctor far more than one nervous reading in an exam room.
What to do next
- Check any reading against the 2025 categories with our free blood pressure chart checker.
- Log a week of home readings in the free Blood Pressure Diary and bring the averages to your appointment.
- See how your blood pressure combines with cholesterol and other factors in our heart attack risk calculator.
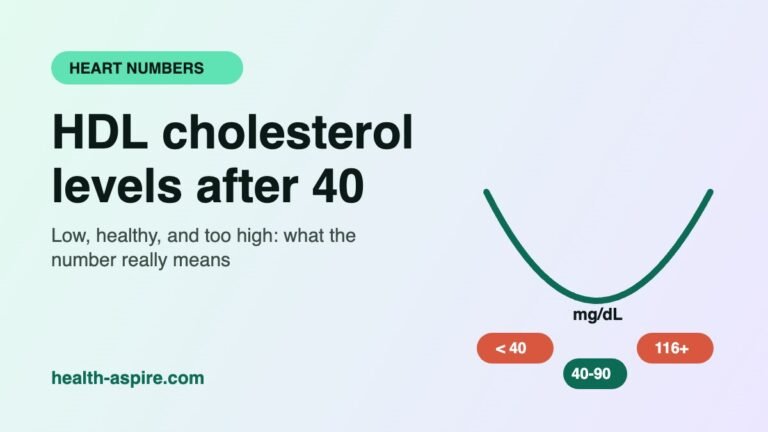
- Compare your lipids with your peers in cholesterol levels by age.
- If you drink most days, read is 2 drinks a day too much, since alcohol raises blood pressure.
- Know the warning signs that are easy to miss in heart attack symptoms in women.
For the bigger picture, our heart health guide brings every heart number worth knowing after 40 together in one place.
FAQ
What is a normal blood pressure for a 60-year-old?
The same as for a 30-year-old: under 120/80, whatever any blood pressure chart by age shows as average. The average 60-plus reading in CDC data is about 136/68, but that average already sits in the stage 1 range. Therefore, most adults in their 60s are treated toward a goal under 130/80.
Is 130/80 good for a 70-year-old?
It is the line where stage 1 hypertension begins, so it is not “good,” but it is not an emergency either. Instead, what happens next depends on your overall risk, other conditions and, if you are frail, a goal you set with your doctor.
Is blood pressure different for men and women?
The categories are identical. Averages differ, though, which is why a good blood pressure chart by age splits men and women: women run lower than men until midlife, then catch up and pass them after 60, when the average top number in women was 139 versus 133 in men.
Which number matters more after 50?
Usually the top number. That is because as arteries stiffen, systolic pressure rises and carries most of the risk, while the bottom number often falls. So a high top number with a normal bottom number still needs attention.
Sources
- Jones D.W., Ferdinand K.C., Taler S.J., et al. 2025 AHA/ACC/AANP/AAPA/ABC/ACCP/ACPM/AGS/AMA/ASPC/NMA/PCNA/SGIM Guideline for the Prevention, Detection, Evaluation and Management of High Blood Pressure in Adults (Circulation, 2025)
- Fryar C.D., Kit B., Carroll M.D., Afful J. Hypertension Prevalence, Awareness, Treatment, and Control Among Adults Age 18 and Older: United States, August 2021 to August 2023. NCHS Data Brief No. 511 (CDC, 2024)
- Wright J.D., Hughes J.P., Ostchega Y., Yoon S.S., Nwankwo T. Mean Systolic and Diastolic Blood Pressure in Adults Aged 18 and Over in the United States, 2001 to 2008. National Health Statistics Reports No. 35 (CDC, 2011)
- Ettehad D., Emdin C.A., Kiran A., et al. Blood pressure lowering for prevention of cardiovascular disease and death: a systematic review and meta-analysis (The Lancet, 2016)
- Lewington S., Clarke R., Qizilbash N., Peto R., Collins R.; Prospective Studies Collaboration. Age-specific relevance of usual blood pressure to vascular mortality (The Lancet, 2002)
- Muntner P., et al. Measurement of Blood Pressure in Humans: A Scientific Statement From the American Heart Association (Hypertension, 2019)
- American Heart Association. Understanding Blood Pressure Readings
This guide is for education and is not medical advice. Talk to your doctor about your own numbers and treatment. See our medical disclaimer.
Free weekly email
A short, honest health email. Every Thursday.
The week’s most useful research for life after 40, explained in plain English, plus one step picked for what matters to you. No spam, no selling your email, unsubscribe in one click.