ASCVD Risk Calculator vs PREVENT: Which to Use After 40
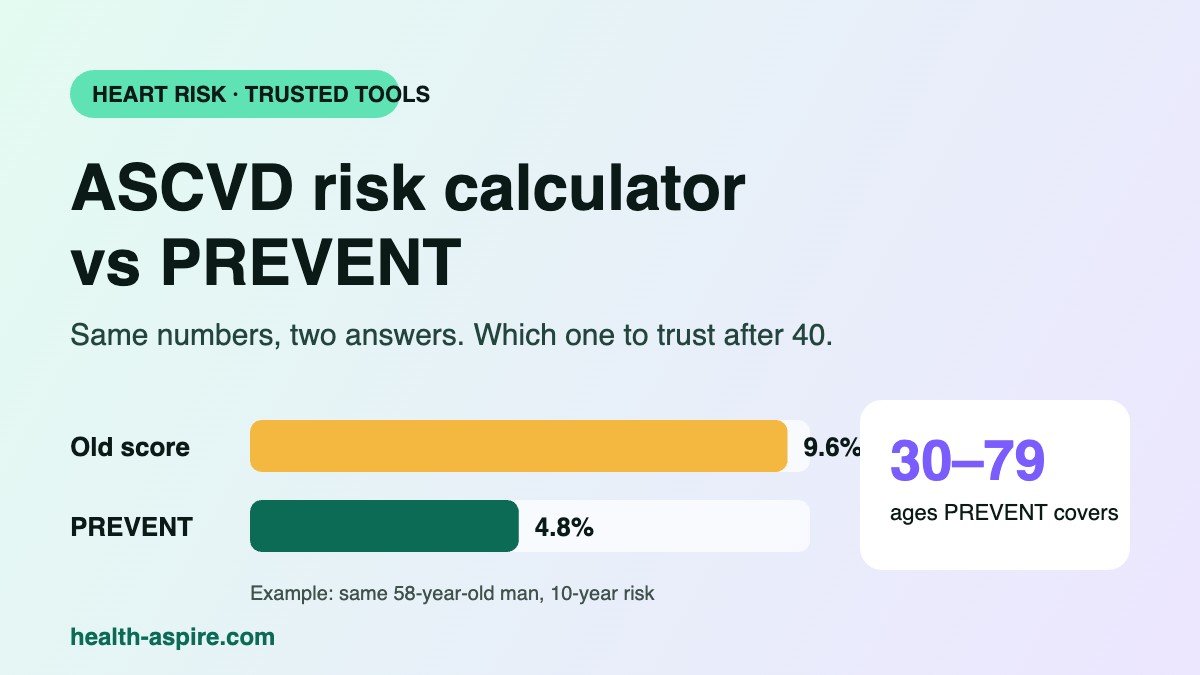
When my own cholesterol came back high, the first thing I wanted to know was simple: how worried should I be? A heart risk calculator, such as the ASCVD risk calculator, is built to answer exactly that. However, what I did not expect was that two respected calculators can give the same person two very different answers.
In short, the classic ASCVD risk calculator (the 2013 Pooled Cohort Equations) estimates your 10-year chance of a heart attack or stroke, but it tends to run high. The American Heart Association’s newer PREVENT calculator uses more recent data, and since 2025 and 2026 the main US blood pressure and cholesterol guidelines use PREVENT instead. If you are a US adult aged 30 to 79 without heart disease, PREVENT is the one to use today.
8.0% vs 4.3%
Average 10-year risk in US adults 40 to 75: old ASCVD equations vs PREVENT
17.3 million
Fewer US adults who would meet statin criteria if PREVENT replaced the old score
30 to 79
Ages PREVENT covers, compared with 40 to 79 for the old calculator
Figures from Anderson and colleagues, JAMA Internal Medicine 2024 (NHANES 2017 to 2020), and the AHA PREVENT development paper.
Same person, two calculators: four worked examples
The fastest way to see the difference, then, is to run identical numbers through both. We made up four readers (these are examples, not real people) and calculated their 10-year risk with the published 2013 Pooled Cohort Equations and with the PREVENT equations. Then we placed each result in the risk category its own guideline uses.
To keep things simple, none of the four has diabetes or takes a statin. Kidney function was set to normal, and BMI came from the height and weight listed.
| Example reader (cholesterol in mg/dL) | Old ASCVD risk calculator, 10-yr | 2018 guideline category | PREVENT heart attack or stroke, 10-yr | 2026 guideline category | PREVENT any CVD incl. heart failure, 10-yr |
|---|---|---|---|---|---|
| Linda, 52, woman. BP 128, total 210, HDL 52, 5 ft 5 in, 165 lb | 1.7% | Low (under 5%) | 1.8% | Low (under 3%) | 2.7% |
| Mark, 58, man. BP 136, total 220, HDL 45, 5 ft 10 in, 200 lb | 9.6% | Intermediate (7.5% to under 20%) | 4.8% | Borderline (3% to under 5%) | 6.9% |
| Denise, 66, woman on a BP pill. BP 132, total 205, HDL 55, 5 ft 4 in, 160 lb | 8.9% | Intermediate | 5.7% | Intermediate (5% to under 10%) | 10.2% |
| Ray, 61, man who smokes. BP 140, total 200, HDL 42, 5 ft 11 in, 190 lb | 18.6% | Intermediate | 8.0% | Intermediate | 12.3% |
What the examples show about each score
For example, look at Mark. With the old score he sits at 9.6%, a level where a statin conversation used to be routine. By contrast, with PREVENT he lands at 4.8%, in the borderline group. That is where the 2026 guideline says cholesterol-lowering treatment is reasonable to consider, and where a coronary calcium scan or risk enhancers such as family history can tip the decision.
Linda shows a second change, because the old ASCVD risk calculator asks for race. If her race were entered as Black, her old score would rise from 1.7% to 2.7% with every other number unchanged. PREVENT, on the other hand, does not use race at all, so she gets one answer.
Old ASCVD risk calculator cut-offs vs the new PREVENT cut-offs
The categories moved down simply because the new calculator gives lower numbers. As a result, comparing a PREVENT result with the old cut-offs would make almost everyone look low risk. So always pair each score with its own scale.
| Risk group | Old ASCVD score (2018 guideline) | PREVENT-ASCVD (2026 guideline) |
|---|---|---|
| Low | Under 5% | Under 3% |
| Borderline | 5% to under 7.5% | 3% to under 5% |
| Intermediate | 7.5% to under 20% | 5% to under 10% |
| High | 20% or more | 10% or more |
Meanwhile, blood pressure decisions use a different PREVENT number. The 2025 AHA/ACC blood pressure guideline looks at 10-year risk of any cardiovascular event, heart failure included. For stage 1 blood pressure (130 to 139 over 80 to 89), a result of 7.5% or more generally means medicine alongside lifestyle changes. Below that, however, lifestyle changes come first, with a recheck in 3 to 6 months.
How we chose these calculators
Every calculator below, therefore, passed four tests. First, it is built on a published, peer-reviewed equation you can look up. Second, a medical society, university or public research group maintains it. Third, it is free to use in a browser. Finally, it states who it is for, by age and region. In addition, no one paid to be listed, and there are no affiliate links.
The ASCVD risk calculator and 5 free alternatives
1. AHA PREVENT online calculator
The official PREVENT calculator from the American Heart Association. It covers ages 30 to 79 and, in addition, gives 10-year and 30-year risk of heart attack or stroke, heart failure, and both combined. Inputs: age, sex, total and HDL cholesterol, systolic blood pressure, BMI, kidney function (eGFR), diabetes, smoking, and whether you take blood pressure or cholesterol medicine. Best for: US adults who want the score their doctor’s guidelines now use. Our own heart attack risk calculator runs the same equations in plain language; we built it, and it is free.
2. ACC CVD Risk Estimator+
The American College of Cardiology tool lets clinicians switch between PREVENT and the old Pooled Cohort Equations, with treatment advice for ages 40 to 79. Best for: bringing to an appointment, mainly because it shows what your doctor sees.
3. MESA Risk Score
The MESA calculator from the NIH-funded Multi-Ethnic Study of Atherosclerosis adds your coronary calcium score. It estimates 10-year coronary heart disease risk before and after the scan, for ages 45 to 85. Best for: anyone who already has a calcium score.
4. QRISK3
The UK calculator covers ages 25 to 84 and adds conditions other tools skip, such as migraine, rheumatoid arthritis, lupus, severe mental illness and steroid tablets. Best for: readers in the UK. Still, its numbers are calibrated to UK patients, so a US reader should treat it as a second opinion only.
5. SCORE2 via HeartScore
The European Society of Cardiology tool uses SCORE2 for ages 40 to 69 and SCORE2-OP for 70 and older, adjusted by country risk region. Best for: readers in Europe.
6. The original ASCVD risk calculator
The Pooled Cohort Equations still appear in many medical records and older apps, and they cover ages 40 to 79. They are worth knowing because older lab portals may still show it. However, the ACC now notes it is no longer supported by its clinical policy or guidelines. So if you see a score from it, ask whether a PREVENT estimate is available.
Why is PREVENT lower than my ASCVD risk calculator score?
Mostly because the old ASCVD risk calculator overestimates. After all, its equations were built from cohorts that began decades ago, when heart attacks were more common. In current US data they overstate 10-year risk by roughly 40% to 50%, according to the 2026 guideline chair. PREVENT, by comparison, was built from more than 6 million US adults in 46 cohorts followed from 1992 to 2017.
For instance, in a national sample of adults aged 40 to 75, average risk was 8.0% with the old score and 4.3% with PREVENT. The gap was largest in people aged 70 to 75: 22.8% versus 10.2%. A lower number is not a free pass, though. Instead, it is simply a more accurate starting point. Also, things the calculator cannot see, such as a high Lp(a) or a strong family history, can still raise your real risk. That is one reason people can have a heart attack with normal cholesterol.
How to judge any heart risk calculator: 6 checks
- Does it name its equation? Look for PREVENT, Pooled Cohort Equations, QRISK3, SCORE2 or MESA. Otherwise, a calculator that will not say how it works is a guess.
- Does your age fit? Outside the stated range, of course, the math stops being reliable.
- Does it match where you live? UK and European tools are tuned to those populations.
- Does it ask about treatment? PREVENT accounts for blood pressure and cholesterol medicine. The old score assumes untreated cholesterol, and QRISK3 is only valid if you do not take a statin.
- Does it say what it predicts? For example, heart attack and stroke, heart disease only, or all cardiovascular events including heart failure are three different numbers.
- Does it give the matching cut-offs? After all, a score without a scale invites the wrong conclusion.
Red flags
- A “heart age” or risk score that asks for an email before showing the result.
- Similarly, results bundled with a supplement, test kit or program to buy.
- No age limits, or promises that work for anyone after a heart attack. These calculators are for people who have not had heart disease or a stroke.
- Pairing a PREVENT number with the old 7.5% statin cut-off, or the reverse.
What to do next
- Get a current lipid panel and blood pressure average, then run them through our free PREVENT heart attack risk calculator. If you have a recent creatinine, our eGFR calculator turns it into the kidney number PREVENT uses.
- Use Before Your Check-up to list your numbers and questions, including: “Which risk calculator did you use, and what category am I in?”
- If you land in the borderline or intermediate group, ask whether a coronary calcium scan or an apoB test would change the plan.
- Over 70 and already on a statin? Read our guide to statins after 70. For the bigger picture, start at our heart health hub.
FAQ
Is the ASCVD risk calculator still accurate?
It still works as math. However, it tends to overestimate risk in today’s US adults, by roughly 40% to 50% in recent data. The 2026 ACC/AHA cholesterol guideline replaced it with PREVENT for primary prevention, so ask for a PREVENT score when you can.
Does the PREVENT calculator include race?
No. PREVENT leaves out race and ethnicity and uses, instead, factors such as kidney function and BMI. An optional add-on uses your zip code as a measure of neighborhood deprivation, which applies to US adults only.
What is a good 10-year heart risk score?
On PREVENT, under 3% is low and 3% to under 5% is borderline. From 5% to under 10% is intermediate, and 10% or more is high. Note that these cut-offs apply only to PREVENT, whereas the old ASCVD score uses higher ones.
Can I use a heart risk calculator if I already take a statin?
PREVENT asks about statin use and can still give an estimate. However, it is not designed to show how much treatment lowered your risk. The old ASCVD score assumes untreated numbers, and QRISK3 is not valid on statins. Either way, talk to your doctor about what your number means once treated.
Sources
- Khan SS, et al. Development and validation of the American Heart Association’s PREVENT equations. Circulation. 2024. doi.org/10.1161/CIRCULATIONAHA.123.067626
- Blumenthal RS, et al. 2026 ACC/AHA multisociety guideline on the management of dyslipidemia. JACC. 2026. doi.org/10.1016/j.jacc.2025.11.016
- 2025 AHA/ACC multisociety guideline for the prevention, detection, evaluation and management of high blood pressure in adults. Hypertension. 2025. doi.org/10.1161/HYP.0000000000000249
- Anderson TS, Wilson LM, Sussman JB. Atherosclerotic cardiovascular disease risk estimates using the PREVENT equations. JAMA Intern Med. 2024. doi.org/10.1001/jamainternmed.2024.1302
- Goff DC Jr, et al. 2013 ACC/AHA guideline on the assessment of cardiovascular risk. Circulation. 2014. doi.org/10.1161/01.cir.0000437741.48606.98
- Grundy SM, et al. 2018 AHA/ACC multisociety guideline on the management of blood cholesterol. JACC. 2019. doi.org/10.1016/j.jacc.2018.11.003
- Hippisley-Cox J, et al. Development and validation of QRISK3 risk prediction algorithms. BMJ. 2017. doi.org/10.1136/bmj.j2099
- SCORE2 working group and ESC Cardiovascular Risk Collaboration. SCORE2 risk prediction algorithms. Eur Heart J. 2021. doi.org/10.1093/eurheartj/ehab309
- McClelland RL, et al. 10-year coronary heart disease risk prediction using coronary artery calcium and traditional risk factors (MESA). JACC. 2015. doi.org/10.1016/j.jacc.2015.08.035
- American College of Cardiology. ACC/AHA issue updated guideline for managing lipids, cholesterol. Press release, March 13, 2026. acc.org
This guide is for education and is not medical advice. Talk to your doctor about your own numbers and treatment. See our medical disclaimer.
Free cheat sheet + weekly email
A short, honest health email. Every Thursday.
The week’s most useful research for life after 40, explained in plain English, plus one step picked for what matters to you. No spam, no selling your email, unsubscribe in one click.
Free gift: our 1-page Lab Markers Cheat Sheet (PDF), the 15 numbers on routine blood and urine tests that matter most after 40. It arrives as soon as you confirm your email.