Heart Disease by State: 2024 Death Rates Ranked, With Map
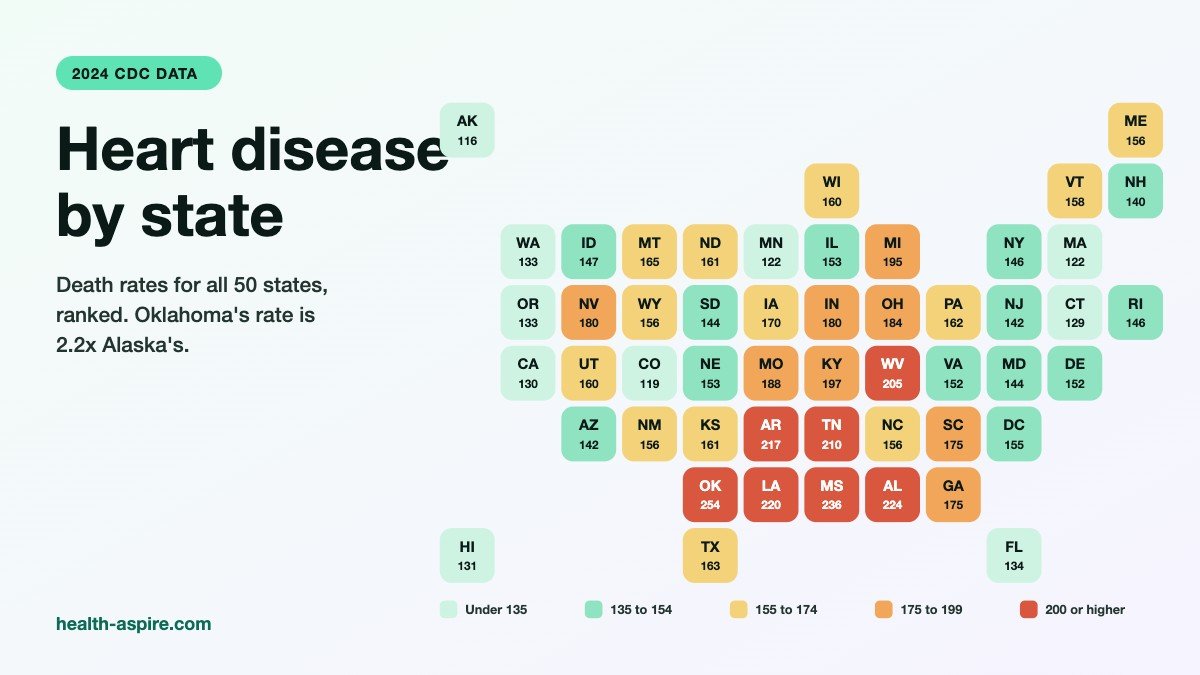
In fact, where you live says a surprising amount about your heart. In 2024, the heart disease death rate in Oklahoma was more than twice the rate in Alaska, even after adjusting for age. So we pulled the latest federal data on heart disease by state into one map, one ranked table and a quick state checker, so you can see where your state stands and, more importantly, what you can do about your own risk.
Heart disease by state: the 2024 map
Check your state
Heart disease by state: the 10 highest and 10 lowest rates
Overall, the highest heart disease death rates cluster in the South and the Ohio and Mississippi valleys. Eight of the ten highest are Oklahoma, Mississippi, Alabama, Louisiana, Arkansas, Tennessee, West Virginia and Kentucky, with Michigan and Missouri close behind. In contrast, the lowest rates are in Alaska, Colorado, Massachusetts and Minnesota, along with Connecticut, California, Hawaii, Oregon, Washington and Florida.
Also, because the rates are age-adjusted, a state with many retirees, such as Florida, is not penalized for having an older population. In other words, the numbers compare states as if they all had the same age mix.
Heart disease death rates by state: full 2024 table
States ranked 1 to 25 (highest rates)
First, the 25 states with the highest heart disease death rates. Also shown is the share of adults told their cholesterol is high.
| Rank | State | Death rate per 100,000 (2024) | Heart disease deaths (2024) | Adults told cholesterol is high (2023) |
|---|---|---|---|---|
| 1 | Oklahoma | 254.3 | 12,432 | 39.2% |
| 2 | Mississippi | 236.5 | 8,586 | 39.8% |
| 3 | Alabama | 223.9 | 14,727 | 42.3% |
| 4 | Louisiana | 220.0 | 12,327 | 39.5% |
| 5 | Arkansas | 217.1 | 8,532 | 40.2% |
| 6 | Tennessee | 210.0 | 18,432 | 40.6% |
| 7 | West Virginia | 205.3 | 5,364 | 45.0% |
| 8 | Kentucky | 196.9 | 11,292 | n/a |
| 9 | Michigan | 194.7 | 26,240 | 35.6% |
| 10 | Missouri | 187.5 | 15,406 | 38.5% |
| 11 | Ohio | 183.7 | 28,929 | 37.4% |
| 12 | Nevada | 179.8 | 7,130 | 39.3% |
| 13 | Indiana | 179.6 | 15,310 | 39.3% |
| 14 | Georgia | 175.2 | 21,725 | 36.9% |
| 15 | South Carolina | 175.0 | 12,494 | 39.3% |
| 16 | Iowa | 169.9 | 7,575 | 36.7% |
| 17 | Montana | 164.8 | 2,617 | 34.0% |
| 18 | Texas | 163.1 | 50,723 | 36.3% |
| 19 | Pennsylvania | 162.4 | 30,768 | n/a |
| 20 | North Dakota | 161.1 | 1,638 | 35.1% |
| 21 | Kansas | 160.9 | 6,074 | 38.5% |
| 22 | Utah | 160.5 | 4,622 | 31.2% |
| 23 | Wisconsin | 160.1 | 12,793 | 35.3% |
| 24 | Vermont | 157.6 | 1,533 | 33.0% |
| 25 | Maine | 156.4 | 3,438 | 38.3% |
States ranked 26 to 51 (lowest rates)
Next, the 26 states and DC with lower rates. Even so, many of them are close to the national average.
| Rank | State | Death rate per 100,000 (2024) | Heart disease deaths (2024) | Adults told cholesterol is high (2023) |
|---|---|---|---|---|
| 26 | Wyoming | 156.2 | 1,201 | 33.8% |
| 27 | New Mexico | 155.5 | 4,563 | 35.4% |
| 28 | North Carolina | 155.5 | 21,126 | 36.3% |
| 29 | District of Columbia | 154.6 | 1,085 | 32.8% |
| 30 | Illinois | 153.2 | 25,150 | 36.3% |
| 31 | Nebraska | 152.7 | 3,767 | 34.0% |
| 32 | Virginia | 151.7 | 16,631 | 39.3% |
| 33 | Delaware | 151.5 | 2,259 | 43.6% |
| 34 | Idaho | 146.6 | 3,449 | 34.4% |
| 35 | Rhode Island | 146.5 | 2,317 | 35.0% |
| 36 | New York | 145.7 | 40,542 | 38.5% |
| 37 | South Dakota | 144.2 | 1,730 | 35.5% |
| 38 | Maryland | 143.7 | 11,450 | 39.3% |
| 39 | Arizona | 141.9 | 14,918 | 38.7% |
| 40 | New Jersey | 141.8 | 17,718 | 39.1% |
| 41 | New Hampshire | 140.2 | 2,899 | 35.8% |
| 42 | Florida | 134.5 | 50,008 | 39.3% |
| 43 | Washington | 133.2 | 12,646 | 36.2% |
| 44 | Oregon | 132.7 | 7,611 | 34.2% |
| 45 | Hawaii | 130.6 | 3,006 | 37.5% |
| 46 | California | 130.4 | 62,439 | 37.0% |
| 47 | Connecticut | 128.9 | 6,697 | 38.6% |
| 48 | Minnesota | 121.9 | 9,228 | 33.8% |
| 49 | Massachusetts | 121.5 | 11,631 | 35.7% |
| 50 | Colorado | 118.8 | 7,882 | 32.5% |
| 51 | Alaska | 116.3 | 831 | 34.2% |
Why heart disease rates differ so much between states
However, no single factor explains the map. The same risk factors that drive heart disease in each of us add up across a whole state:
- Blood pressure, cholesterol and diabetes. These are the core medical risk factors, and they are more common in some regions than others.
- Smoking. Smoking rates remain higher in parts of the South and Appalachia.
- Weight and activity. Obesity and inactivity raise blood pressure, blood sugar and cholesterol together.
- Income, rural living and access to care. Distance to a doctor, insurance and the cost of medicines affect whether risk factors get found and treated.
In our data, states with a higher share of adults told they have high cholesterol also tended to have higher heart disease death rates (a moderate correlation of about 0.5). Still, that is a pattern, not proof that cholesterol alone explains the gap, but it fits what decades of research show about LDL cholesterol and heart disease.
High cholesterol by state
Across the US, 36.9% of adults who had their cholesterol checked were told it was high in 2023. At the top, West Virginia had the highest share at 45.0%, followed by Delaware (43.6%) and Alabama (42.3%). Meanwhile, Utah had the lowest at 31.2%, followed by Colorado (32.5%) and Vermont (33.0%). However, data for Kentucky and Pennsylvania were not available for that year.
Of course, a “high” result can mean different things, so it helps to understand your own numbers. To begin, start with our guides to cholesterol levels by age and what LDL 100, 130, 160 and 190 mean.
Your state is not your destiny: what you can control
- Know your 10-year risk. Our free heart risk calculator uses the American Heart Association PREVENT equations and takes about two minutes.
- Know your cholesterol numbers, including LDL and, if your doctor agrees, ApoB and a one-time Lp(a) test.
- Check your blood pressure at home or at a pharmacy, and repeat it if it is high.
- Learn the warning signs, especially the ones that are easy to miss in women: see heart attack symptoms in women.
- Move and build strength. Regular activity improves blood pressure, blood sugar and cholesterol together. Start with our guide to strength training after 40.
Heart disease by state: FAQ
Which state has the highest heart disease death rate?
Oklahoma, with 254.3 age-adjusted deaths per 100,000 people in 2024, followed by Mississippi (236.5) and Alabama (223.9).
Which state has the lowest heart disease death rate?
Alaska, with 116.3 deaths per 100,000 in 2024, followed by Colorado (118.8) and Massachusetts (121.5).
Is heart disease still the leading cause of death in the US?
Yes. Heart disease has been the leading cause of death in the United States for decades, for both men and women. Fortunately, the good news is that the national age-adjusted rate fell from 162.1 per 100,000 in 2023 to 157.6 in 2024.
What does age-adjusted mean?
In short, it is a statistical method that removes the effect of different age mixes, so a state with more older residents can be compared fairly with a younger state. However, it does not change the actual number of deaths.
How we made this ranking
Heart disease deaths and age-adjusted death rates come from the CDC National Center for Health Statistics (CDC WONDER, Underlying Cause of Death files, 2024), as published by KFF. As a check, the state deaths add up exactly to the national total of 683,491. Cholesterol figures come from the CDC Behavioral Risk Factor Surveillance System 2023 as published by America’s Health Rankings. Finally, you are welcome to use the map, chart and table in your own article or newsletter with a link back to this page.
- Heart risk calculator
Your 10-year risk in two minutes.
- Cholesterol levels by age
What is healthy for your age.
- Heart health after 40
All our heart guides in one place.
Sources
- KFF. Heart Disease Deaths and Death Rates per 100,000 Population, 2024 (data: CDC WONDER, Underlying Cause of Death 1999-2024)
- CDC WONDER. Underlying Cause of Death database
- America’s Health Rankings. High Cholesterol by state (CDC BRFSS 2023)
- CDC. Heart Disease Facts
This page is for education and is not medical advice. State averages cannot tell you your personal risk. Talk to your doctor about your own numbers. See our medical disclaimer.
Free weekly email
A short, honest health email. Every Thursday.
The week’s most useful research for life after 40, explained in plain English, plus one step picked for what matters to you. No spam, no selling your email, unsubscribe in one click.