Your lab report is full of numbers, abbreviations and ranges, and most of it is never explained. This free Lab Markers Cheat Sheet has your blood test results explained on three printable pages: the 15 numbers on routine blood and urine tests that matter most after 40, what each range means, which guideline it comes from, and what to ask your doctor.
You’re in
Your cheat sheet is ready
We also sent it to your inbox, so you can find it again before your next check-up.
Download the cheat sheet (PDF)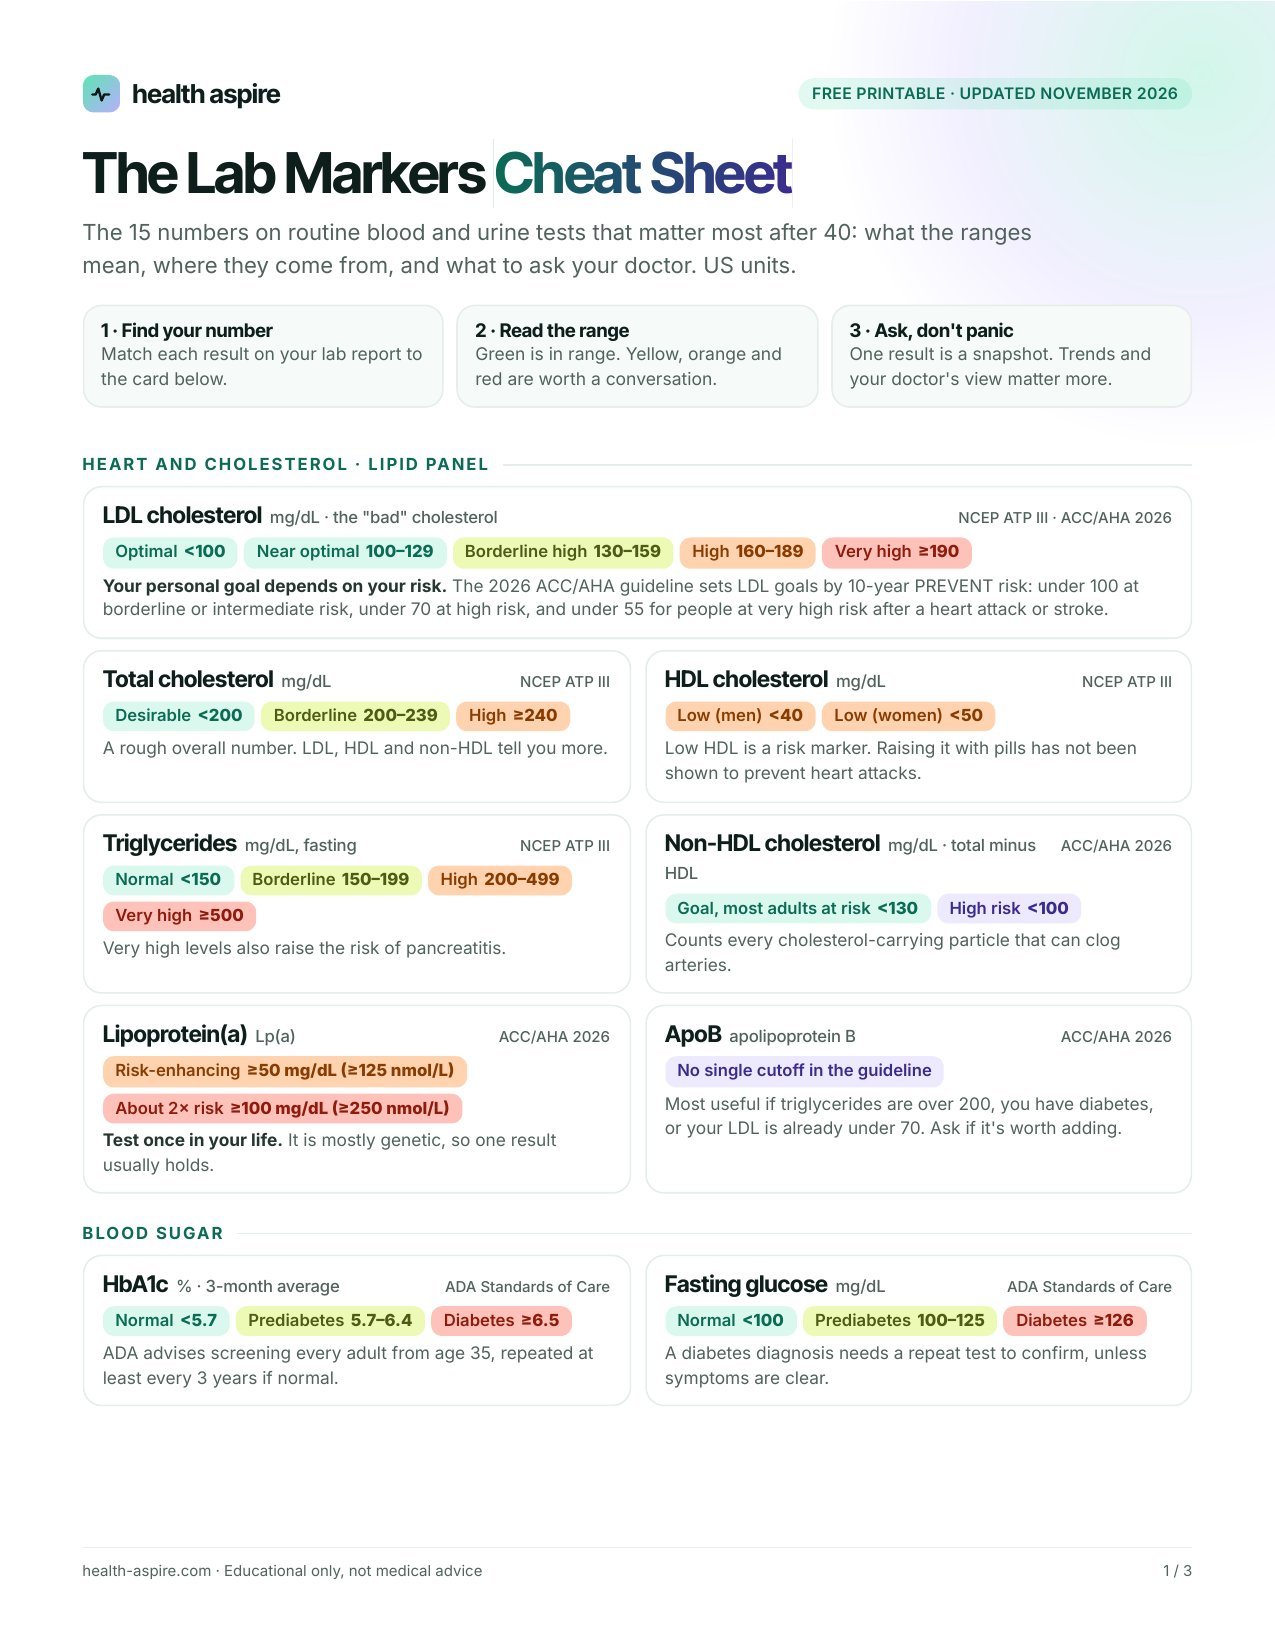
Free printable · 3 pages · US units
Get the Lab Markers Cheat Sheet
Enter your email and we’ll send the PDF straight to your inbox.
What is inside the cheat sheet
- Heart and cholesterol: LDL, total cholesterol, HDL, triglycerides, non-HDL cholesterol, Lp(a) and ApoB, with the LDL goals from the 2026 ACC/AHA guideline.
- Blood sugar: HbA1c and fasting glucose, with the American Diabetes Association cutoffs for prediabetes and diabetes.
- Kidneys, liver, thyroid and more: eGFR and urine albumin (KDIGO 2024), ALT, hs-CRP, TSH and vitamin D, plus the 2025 blood pressure categories.
- 5 questions for your doctor and a fillable table: type your results right into the PDF on your phone or computer, or print it and write them in, three times, so you can see the trend.
Blood test results explained: how to read your report after 40
Most lab reports print a “reference range” next to each result. That range describes typical results in the lab’s population, and it is not always the same as a healthy target. For example, many reports print one LDL cholesterol range for everyone. However, the 2026 ACC/AHA guideline ties the LDL goal to your heart risk: below 100 mg/dL at borderline or intermediate risk, below 70 mg/dL at high risk, and below 55 mg/dL for people at very high risk after a heart attack or stroke.
The cheat sheet shows both views side by side: the standard categories you see on your report, and the goal that fits your risk. It also names the guideline behind every number, so you can check it yourself.
Three numbers many people never see
First, Lp(a). It is mostly set by your genes, and the 2026 ACC/AHA dyslipidemia guideline recommends measuring it at least once in adulthood. A level of 50 mg/dL (125 nmol/L) or higher counts as a risk-enhancing factor. Second, ApoB, which counts the particles that can clog arteries and helps most when triglycerides are high or you have diabetes. Third, the urine albumin-to-creatinine ratio, a simple urine test that can flag kidney damage years before eGFR drops.
None of these are part of every routine panel, so it helps to ask for them by name. In addition, one result is only a snapshot. Trends over time, and your doctor’s view of your full history, matter more than any single number.
Turn your numbers into answers
Already have your results? Use the free 10-year heart risk calculator to see which LDL goal fits you, convert your HbA1c with the A1c calculator, or check kidney function with the eGFR calculator. Not sure which tests you need at your age? Start with Before Your Check-up.
Education only, not medical advice. Reference ranges vary between labs. Compiled by Georgi Pavlov, founder and editor of Health Aspire (not a medical professional), from the ACC/AHA, ADA, KDIGO, ACG, AHA/CDC, Endocrine Society and NIH sources listed in the PDF.